 “It is a capital mistake to theorize before one has data.” - Sherlock Holmes, From “A Study in Scarlett” (Sir Arthur Conan Doyle)
The popular fictional private detective character, Sherlock Holmes, was a master of observation and relentlessly dug for the facts to solve cases. L&D professionals can take a page from this infamous sleuth to deeply understand their learning programs with the goal of optimizing courses for maximum learner engagement and effectiveness.
What are Learning Analytics Exactly?
“Analytics is the discovery, interpretation and communication of meaningful patterns in data.”¹
“Learning analytics is the measurement, collection, analysis and reporting of data about learners and their contexts, for purposes of understanding and optimizing learning and the environments in which it occurs.”²
Avoiding "Vanity" Analytics
Vanity metrics in learning management systems are anything that is not actionable such as: how many users, how many logins, how many views and time spent.
Download our eBook, LMS 101: Learning Analytics - learn how to get the most out of your LMS with learning analytics even if you know nothing about analytics!
Adopting "Lean Startup" Thinking
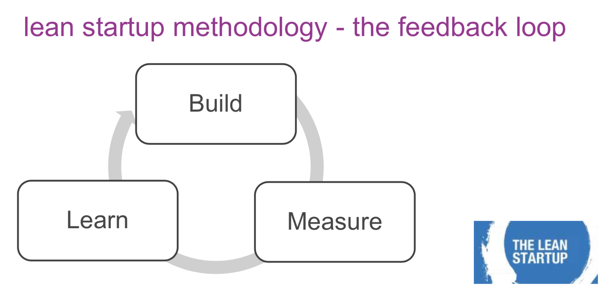
In the #1 New York Times bestseller The Lean Startup: How Today’s Entrepreneurs Use Continuous Innovation to Create Radically Successful Businesses, author Eric Ries introduces the Lean Startup approach which is inspired by lessons taken from lean manufacturing methods. It relies on validated learning—rapid scientific experimentation and counter-intuitive practices that shorten product development cycles, measure actual progress without resorting to vanity metrics and learn what customers really want. Adopting this approach enables companies to leverage human creativity more effectively and become more capital efficient by being able to shift directions with agility and alter plans quickly. The lean startup methodology is based on a feedback loop as the diagram below depicts:

Lean Learning Analytics
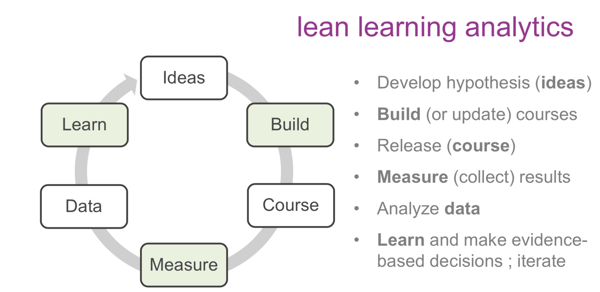
The Lean Learning methodology consists of both qualitative and quantitative measures and the steps involved are outlined in the diagrams below. The methodology follows the points in this continuous loop:
- Based on learning needs within the company, ideas for courses are put forward and courses are built.
- Courses are released to learners and results of their usage are captured.
- The data captured is analyzed, based on specific KPI’s.
- Data is used to learn from and make informed decisions.
- Repeat the process for each course.

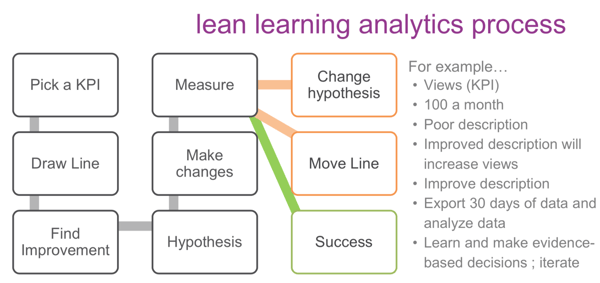
The diagram below shows how to measure, make changes and find improvements in learning programs using different KPIs. In the example below, to measure the impact of improving a course description, while overly simplistic, is intended to show how making minimal changes can be quick and have potential high impact.

By adopting a lean approach for continuously analyzing the engagement and effectiveness of your learning programs, you will be better able to:
- Understand Learner needs and expectations
- Identify ‘at risk’ Learners
- Build changes to prevent Learner ‘failure’
- Increase retention and identify future courses
- Identify user experience (UX) problems
- Identify where to invest in the future
Does your LMS enable you to see all of your learning data to be able to analyze your programs and make more informed decisions? Take a demo of Zoola Analytics today and get lean!
¹Source: wikipedia
²Source: wikipedia


