“Research and Markets” recently generated a report that predicts the learning analytics market to increase by over 25% by 2020 — that’s a quarter of the market, in just four years.
R&M analysts identify two major influences in this projected growth: a more streamlined focus on administration of budget, and an emphasis on personalized learning methods.
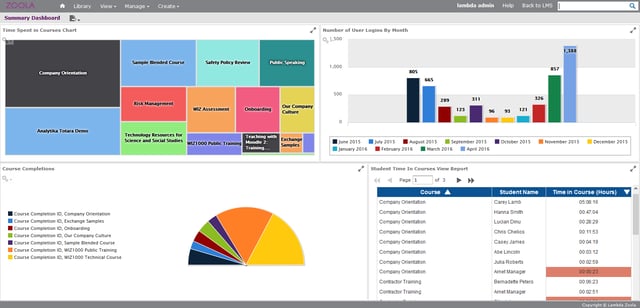
The first influence is more obvious to anyone who has used or managed a learning management system. With the right tools to automate LMS reporting and analysis tools, less people time is needed to crunch numbers, correlate outcomes, make compelling visuals (graphs, charts, etc.), and derive insights. The software does it for you, across learning/training streams, courses, people and tasks.
But what about "personalized learning methods? " — what does this mean, and how does it relate to learning analytics?
The Challenge: Measuring Learning
In traditional learning environments, students were dependent on teachers to deliver learning, limiting education and access to learning to content provided by instructors. With the age of technology came learning management systems, which have become commonplace in every classroom, and workplace. LMS’s give learners, employees, and students the flexibility to learn on their own time, with the support of resources and learning material stored in their LMS. This accommodates different learning patterns, and also nurtures interest in the topics and concepts that appeal to each person. A challenge that arises here however, is how to monitor the time learners are actually spending in a course — that is, how to ensure that a minimum time spent learning is reached, and ensure that learning is occurring.
The Answer: A LMS Reporting and Analytics Solution
Enter learning analytics. LMS Reporting and analytics solutions have the power to measure the time learners are spending in courses, measure learning retention, and determine whether learning goals are being met. Increasing demand for solutions that tell organizations whether their people are reaching their learning goals is now a critical objective, and part of what is driving the 4-year growth objective.

We’ve experienced this demand firsthand, both prior to and subsequent to the development of our LMS reporting and analytics solution, Zoola Analytics.
Just a couple of weeks ago, Lambda Solutions had the pleasure of showcasing Zoola at the ATD conference in Denver. In their article written by Gary Woodill, Float Enterprise Mobility Services compiled a list of the 10 fresh innovations featured at ATD, where Lambda Zoola took the top spot. Woodill acknowledges that there has not been an adequate reporting or analytics solution to support open source learning management systems, or fill the reporting gap in the market — until now. This recognition — along with the overwhelmingly positive reception Zoola has received in its first year since launching — contributes to the sentiment that analytics is a growing demand, and is emerging as a dominating market in the eLearning sector. Float saw firsthand how Zoola meets the demand through custom LMS reports, dashboards, charts, and graphs from the data accumulated by the learning management systems (either Moodle or Totara LMS).
If you’d like to learn how you can use Zoola Analytics to help you achieve your organizational learning goals, register for our upcoming webinar: Advanced LMS Reporting in Moodle & Totara with Zoola Analytics. You can also check out our new video!


